

A report opens on the period the dashboard was showing. The names at the top switch between reports and keep your period and filters. Dashboard takes you back.
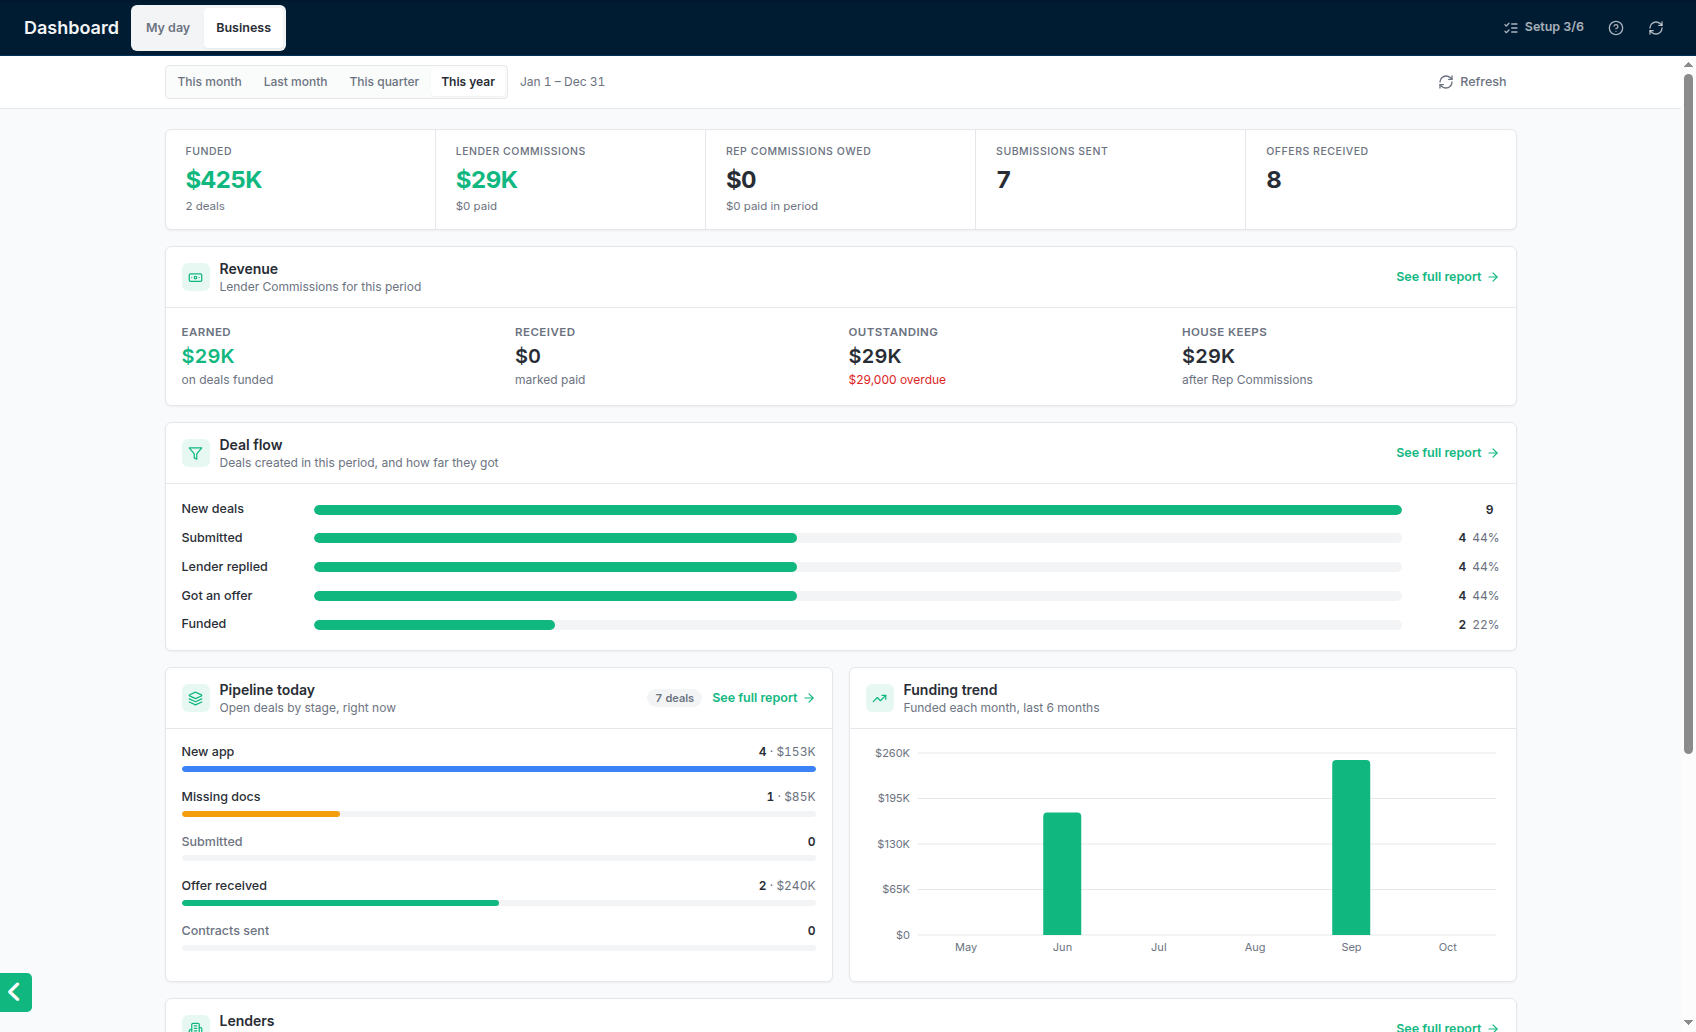
The Business tab. Each card's See full report opens the report behind it.
Who sees which report
A manager’s reports say Your reps’ deals only at the top. Reps have their own numbers on the dashboard’s My day; see Your dashboard.
Pick a period and a comparison
The bar under the title sets what every number on the page counts.- Period: This month, Last month, This quarter, Last quarter, This year, Last 12 months, or Custom with a start and end date. Dates are in your account’s time zone, and the dates covered are shown next to the filters.
- Compare to: Previous period (the same length just before), Same period last year, or No comparison. With a comparison on, each figure shows how much it went up or down, in green when that’s good and red when it isn’t. More declines show in red, for example.
- Charts go by week for periods up to about two months, and by month for longer ones.
Narrow it down
- Lender shows only what went to, was offered by or was funded by one lender.
- Rep shows only one rep’s deals, or No owner for deals with no originator and no closer.
- The Production report also has Originator or closer, to credit deals to only one role.
See the deals behind a number
Click any figure with an arrow, a table row, a funnel step or a reason. A panel opens on the right with the deals, submissions, offers or commissions that make up that number, with the count and total at the top. Click a row to open the deal. Long lists show 50 at a time.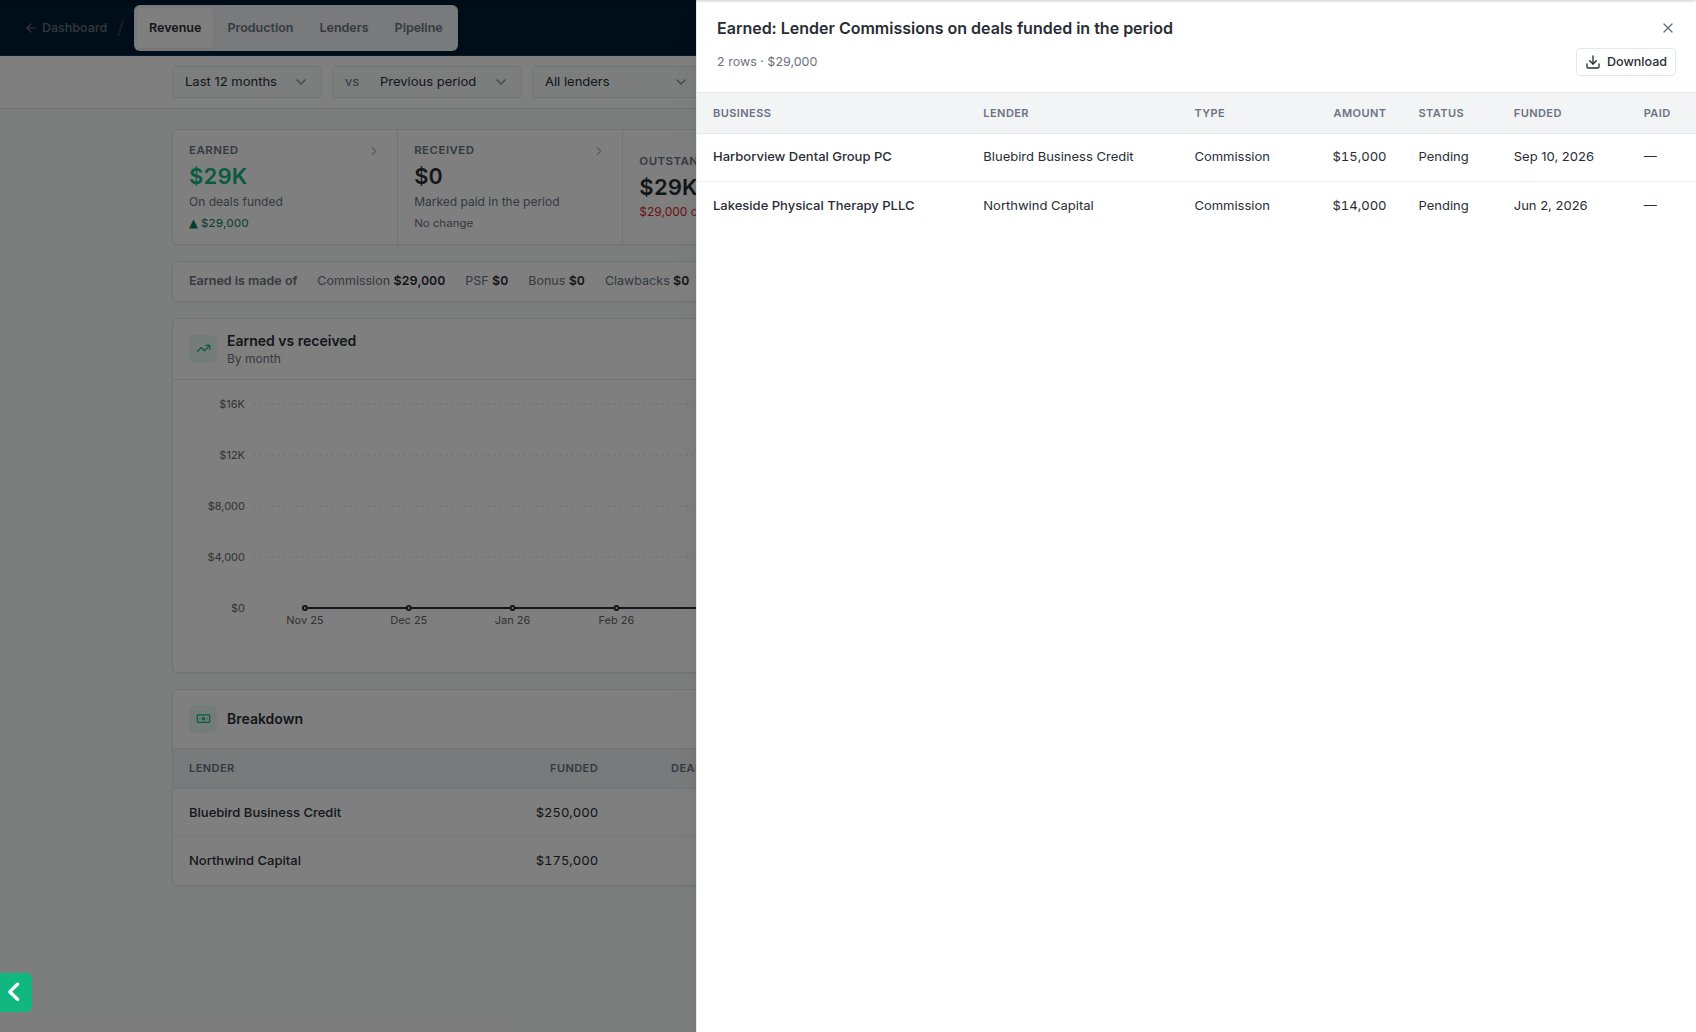
Clicking Earned on the Revenue report: the Lender Commissions behind the figure, with the total at the top and Download.
Download
Every table and every panel has Download: choose Excel (.xlsx) or CSV. You get what’s on screen for your period and filters, with amounts as numbers you can add up. The file is named after the report, the view and the dates, for example Revenue - By lender - 2026-10-01_to_2026-10-31.xlsx.The numbers match the dashboard
The reports and the Business tab count the same way, so a number on a card is the same number in its report:- Funded is the deals marked funded in the period. See Marking a deal funded.
- Sent is submissions that went to a lender in the period.
- Offers count each offer once. A revised offer doesn’t count again.
- Lender Commissions count net of clawbacks. Cancelled ones never count.
- A deal counts for its originator and its closer, but a total counts it once.
Take the tour
The first time an admin or manager opens a report, a short tour shows the report switcher, the period bar, the clickable figures and Download. To see it again, click ? in the top bar and choose Replay tour: Reports.The old Reports page, with its generated and scheduled reports, was replaced by these reports in October 2026. Old links to it open the dashboard.