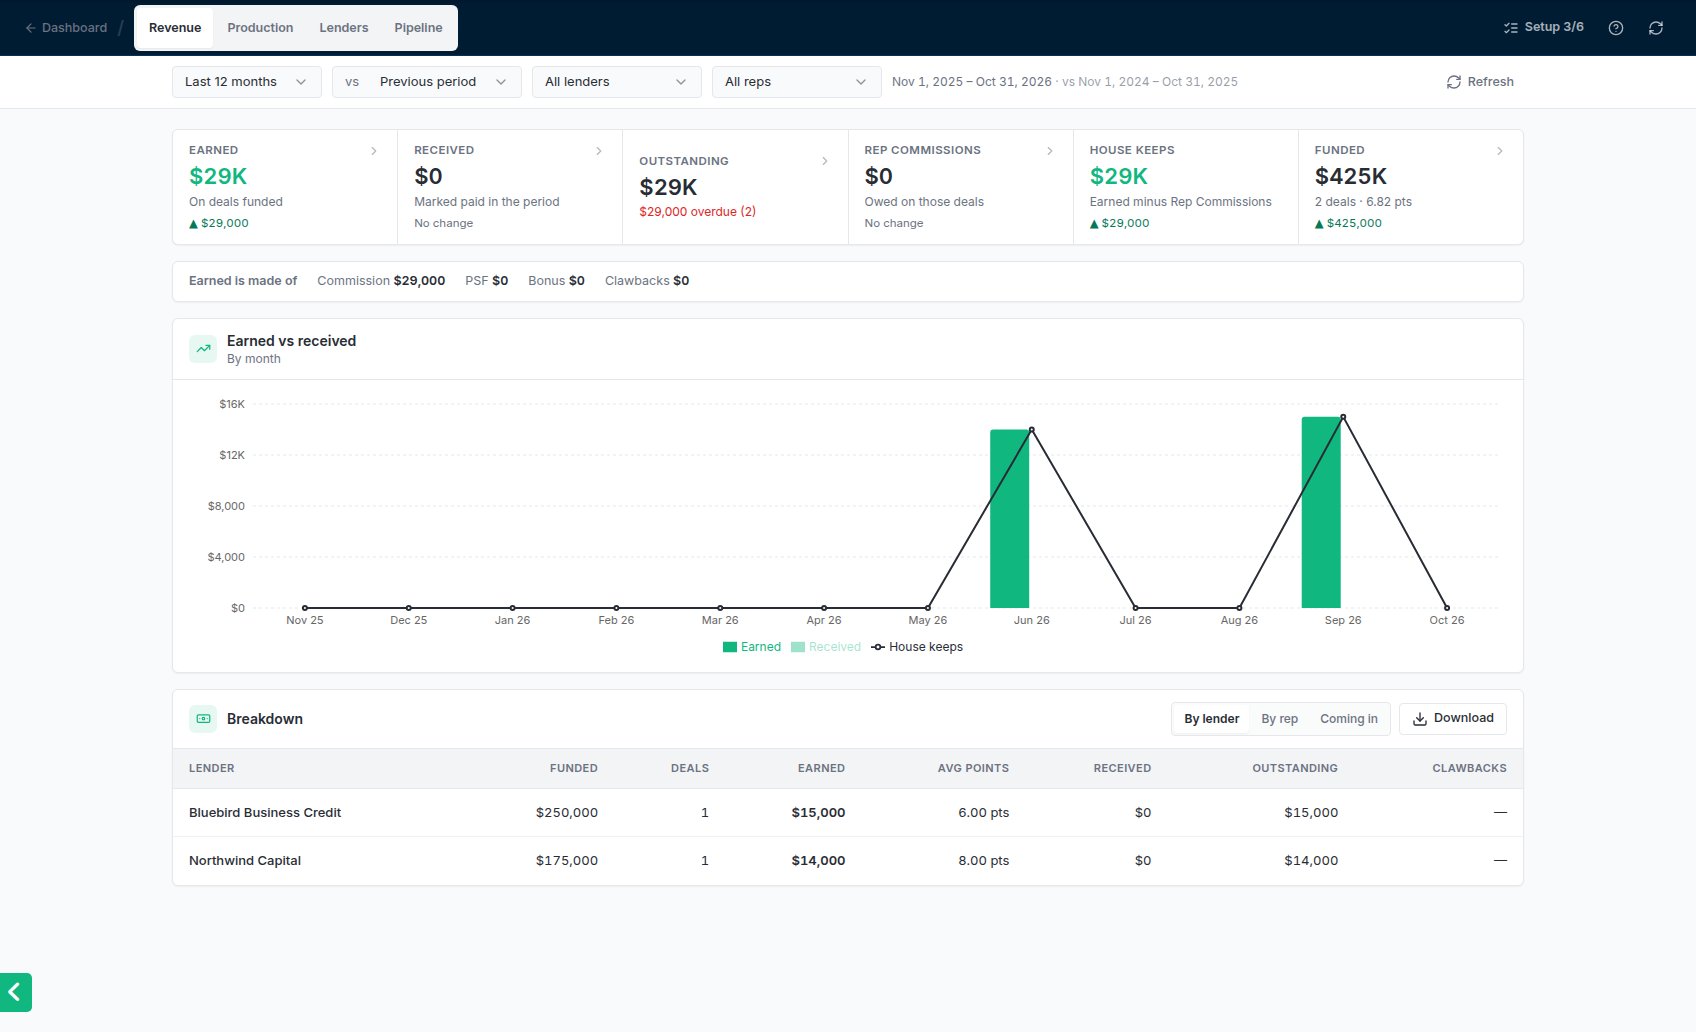
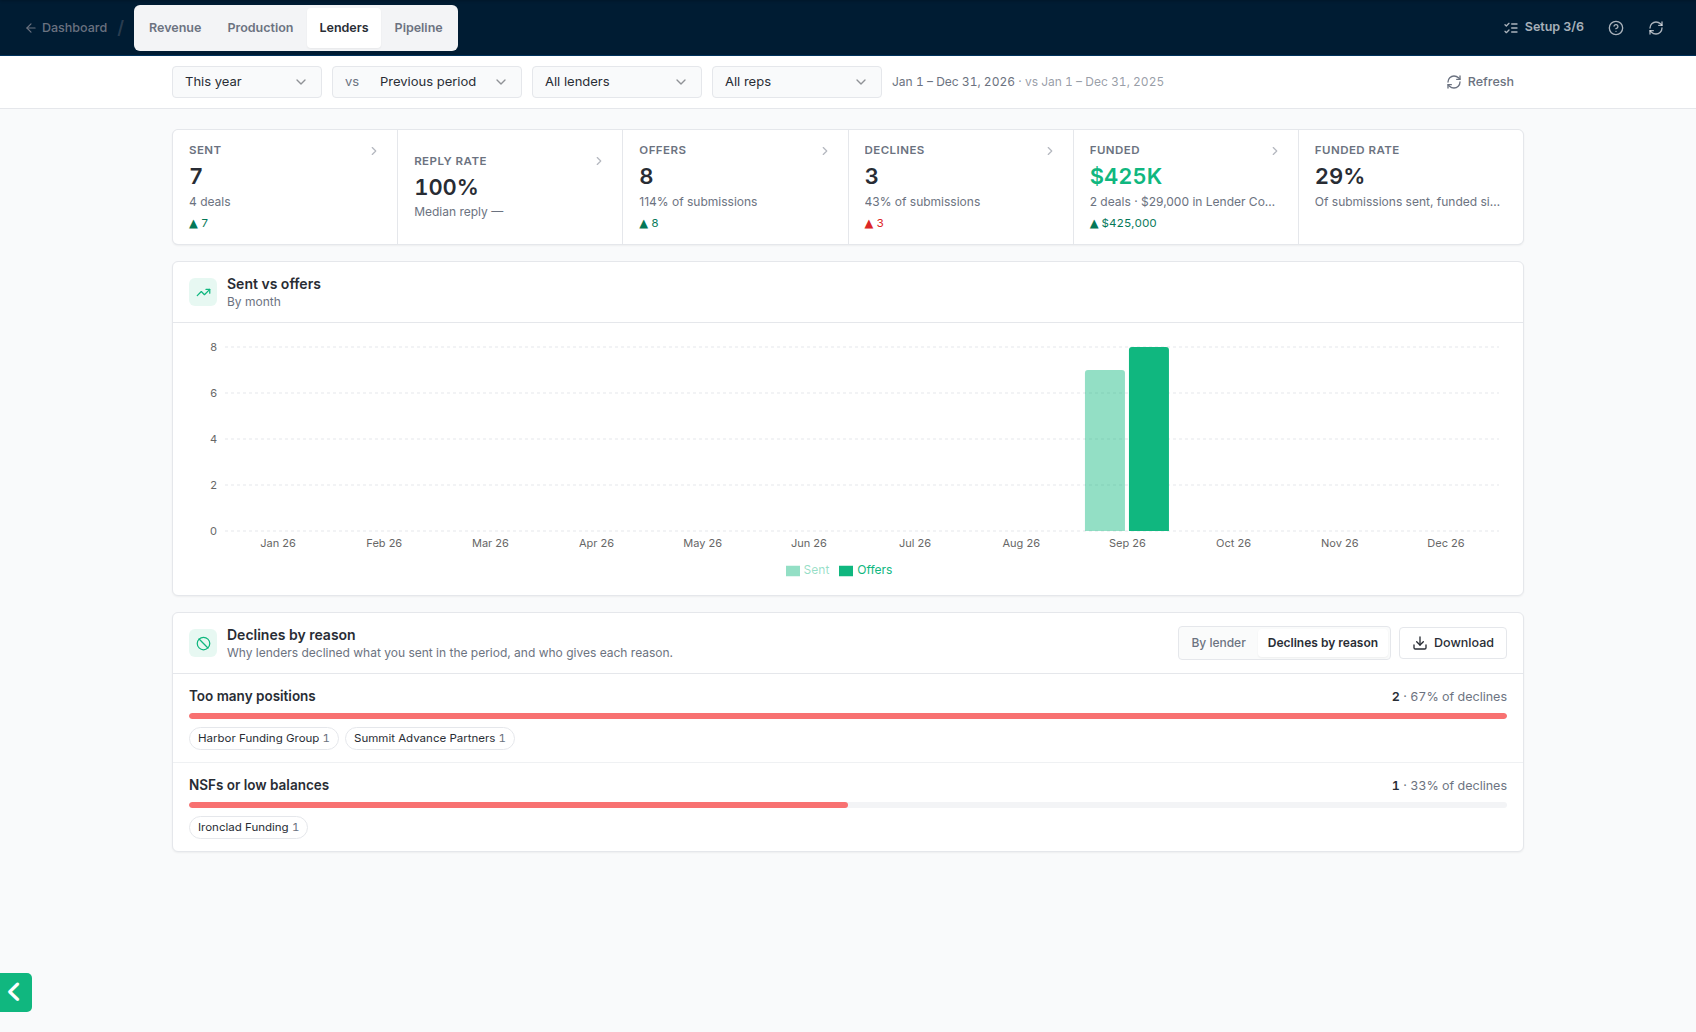
Every card on the dashboard’s Business tab now has See full report, which opens the report behind it on the same period. There are four, in the order an owner reads the business:
Revenue, for admins: Lender Commissions earned on the period’s fundings, what was received, what’s still owed and what’s overdue, and what the house keeps after Rep Commissions. Coming in lists every commission not received yet, overdue first.
Production: each rep’s new deals, submissions, offers, fundings, conversion and days to fund, with Rep Commissions earned, paid and pending. Click a rep for their deals and a Rep Commission statement to download.
Lenders: reply rate and how fast each lender answers, offers and their terms against what was asked for, fundings, and Declines by reason, which shows why each lender says no.
Pipeline: how far the period’s new deals got, which deals are stuck in a stage, why deals are lost, and which have gone quiet.
Pick any period, compare it with the one before or the same one last year, and filter by lender or rep. Click any number to see the deals behind it, and download any table or list as Excel or CSV. Managers get Production, Lenders and Pipeline for their reps’ deals.Every lost deal and every decline now has a reason. Closing out a deal, moving it to Dead or dropping it on Dead asks why it was lost, and marking a submission declined asks why the lender said no. Declines read from lenders’ emails are filed under a reason on their own, and past declines were sorted the same way.The old Reports page is gone, and links to it open the dashboard. See Reports.