> ## Documentation Index
> Fetch the complete documentation index at: https://docs.nextlevelmca.com/llms.txt
> Use this file to discover all available pages before exploring further.
# What does the Production report show?
> Each rep's deals, submissions, offers and fundings for a period, how often their new deals fund, and their Rep Commissions, with a statement to download.
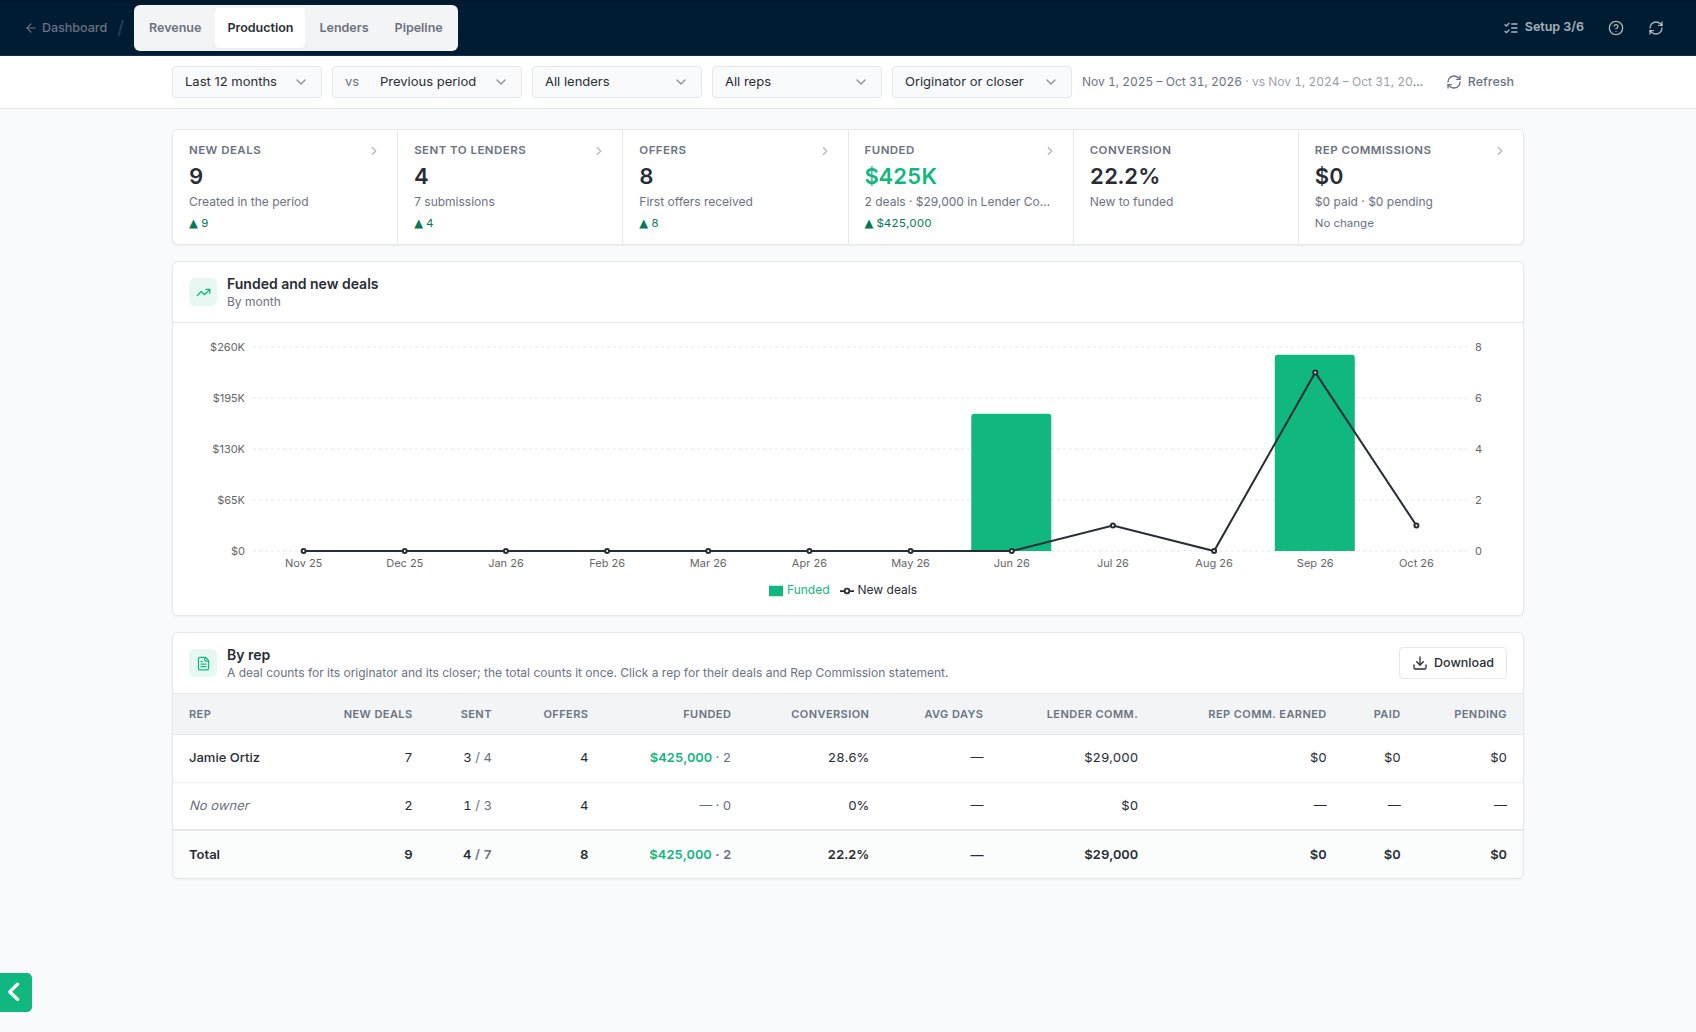
The Production report shows who is producing: for each rep, the deals they brought in, what they sent to lenders, the offers that came back, what funded, and the Rep Commissions they earned. Admins see the whole account. Managers see their reps' deals, without Lender Commissions.
Open it from the dashboard: **Business** tab → **Team** card → **See full report**. The Team card shows once your account has more than one person; you can also switch to **Production** from any other report. For the period, comparison, filters and downloads, see [Reports](/help/reports).
 ## The figures
| Figure | What it counts |
| - | - |
| **New deals** | Deals created in the period. |
| **Sent to lenders** | Deals sent to at least one lender in the period, with the number of submissions under it. |
| **Offers** | Offers received in the period. A revised offer doesn't count again. |
| **Funded** | The amount and number of deals funded in the period. Admins also see the Lender Commissions on them. |
| **Conversion** | Of the new deals in the period, the share that has funded, and how many days from new deal to funded on average. A deal funded the day it was entered counts as 0 days. A deal entered after it had already funded is left out of the average. |
| **Rep Commissions** | Rep Commissions earned in the period (splits created in it), with how much was paid in the period and how much is pending right now. |
Click a figure to list what's behind it, with each deal's originator and closer.
## By rep
One row per rep: **New deals**, **Sent** (deals / submissions), **Offers**, **Funded** (amount · deals), **Conversion**, **Avg days** to fund, **Lender Comm.** (admins only), and Rep Commissions **earned**, **paid** and **pending**.
* **A deal counts for its originator and its closer.** Each rep's row shows everything they worked on, so a deal two reps share is on both rows. The **Total** row counts each deal once, so it can be less than the rows added up.
* **No owner** lists deals with no originator and no closer. Click it to see them.
* **Originator or closer** in the filter bar changes the credit: **As originator** or **As closer** shows each rep only the deals they had that role on. Deals keep counting once in the totals either way.
## One rep's deals and their statement
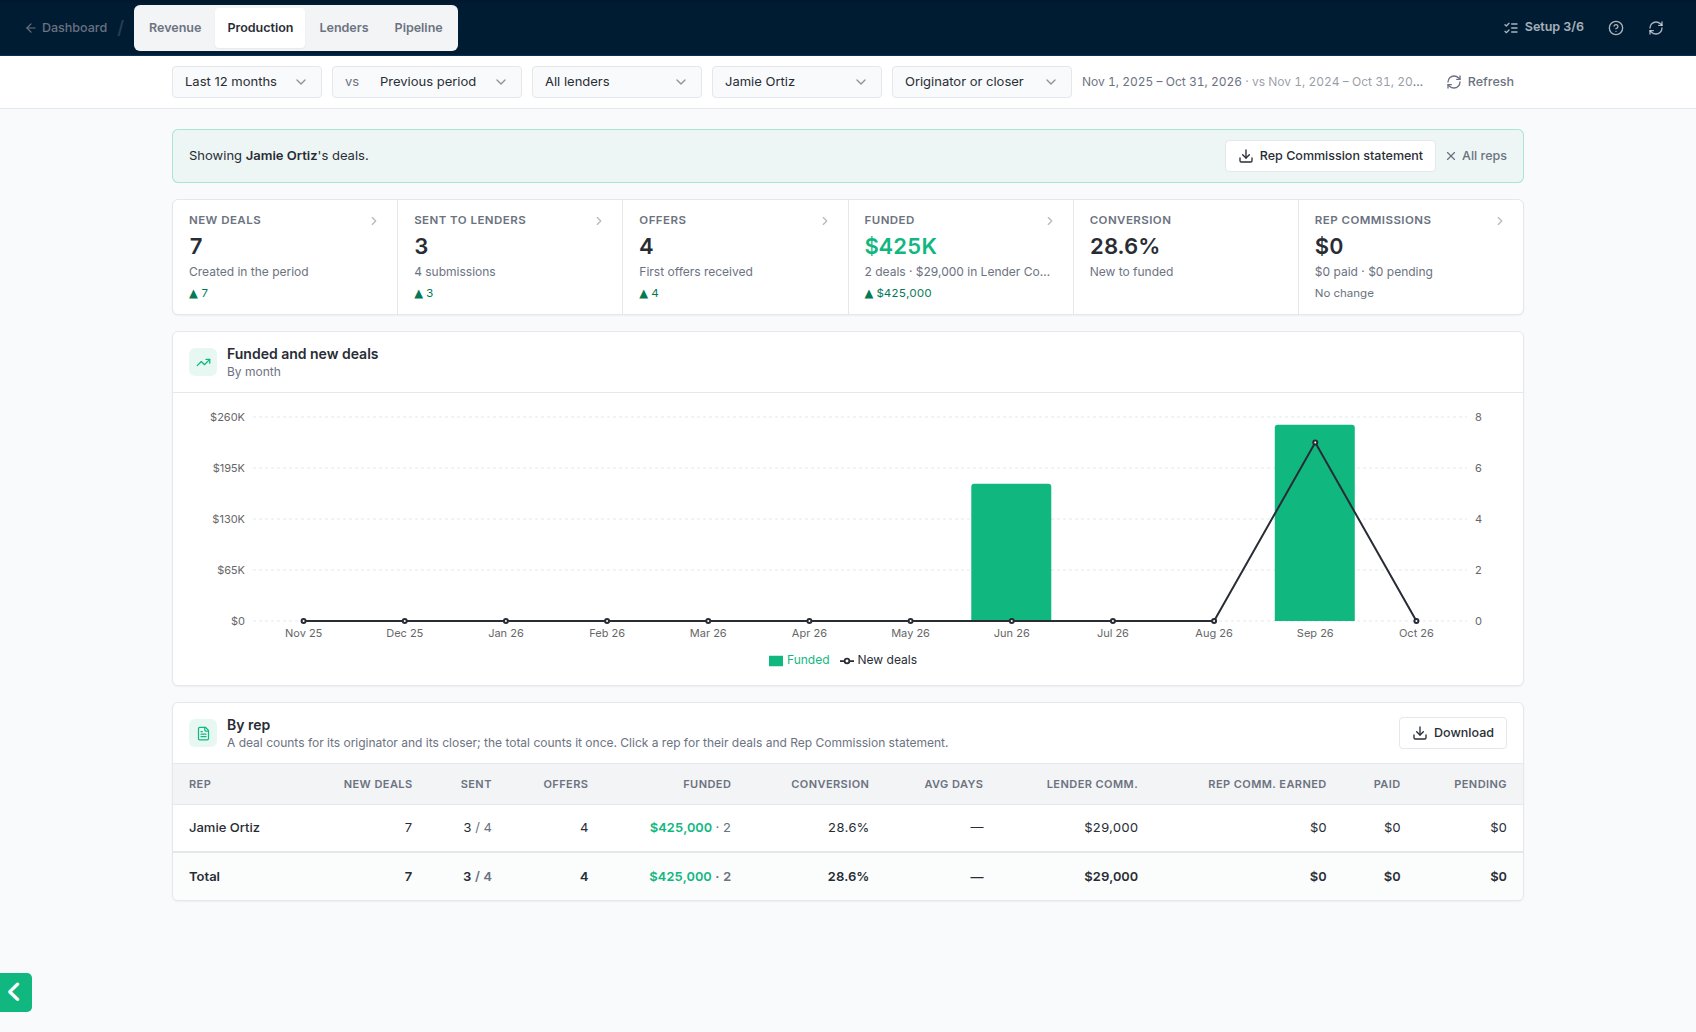
Click a rep's row. The whole report narrows to their deals, and a bar says **Showing *name*'s deals**. From there:
* **Rep Commission statement** downloads, as Excel or CSV, every Rep Commission they earned in the period: the business, lender, funded date and amount, the kind of split, the split %, the amount, its status and paid date, with **Total**, **Paid** and **Pending** at the bottom.
* **All reps** goes back to everyone.
## The figures
| Figure | What it counts |
| - | - |
| **New deals** | Deals created in the period. |
| **Sent to lenders** | Deals sent to at least one lender in the period, with the number of submissions under it. |
| **Offers** | Offers received in the period. A revised offer doesn't count again. |
| **Funded** | The amount and number of deals funded in the period. Admins also see the Lender Commissions on them. |
| **Conversion** | Of the new deals in the period, the share that has funded, and how many days from new deal to funded on average. A deal funded the day it was entered counts as 0 days. A deal entered after it had already funded is left out of the average. |
| **Rep Commissions** | Rep Commissions earned in the period (splits created in it), with how much was paid in the period and how much is pending right now. |
Click a figure to list what's behind it, with each deal's originator and closer.
## By rep
One row per rep: **New deals**, **Sent** (deals / submissions), **Offers**, **Funded** (amount · deals), **Conversion**, **Avg days** to fund, **Lender Comm.** (admins only), and Rep Commissions **earned**, **paid** and **pending**.
* **A deal counts for its originator and its closer.** Each rep's row shows everything they worked on, so a deal two reps share is on both rows. The **Total** row counts each deal once, so it can be less than the rows added up.
* **No owner** lists deals with no originator and no closer. Click it to see them.
* **Originator or closer** in the filter bar changes the credit: **As originator** or **As closer** shows each rep only the deals they had that role on. Deals keep counting once in the totals either way.
## One rep's deals and their statement
Click a rep's row. The whole report narrows to their deals, and a bar says **Showing *name*'s deals**. From there:
* **Rep Commission statement** downloads, as Excel or CSV, every Rep Commission they earned in the period: the business, lender, funded date and amount, the kind of split, the split %, the amount, its status and paid date, with **Total**, **Paid** and **Pending** at the bottom.
* **All reps** goes back to everyone.
 ## Common problems
That's expected when deals have both an originator and a closer: the deal is on both reps' rows but counts once in the total.
Conversion needs new deals in the period. Days to fund needs at least one of those deals funded, and a deal entered after it funded doesn't count toward it.
Rep Commissions come from splits on funded deals. Check the rep's commission percentage, see [Rep commission percentages](/help/rep-commission-percent), and the deal's splits on the **Rep Commissions** page.
This documentation is built and hosted on [Mintlify](https://mintlify.com), a developer documentation platform.
## Common problems
That's expected when deals have both an originator and a closer: the deal is on both reps' rows but counts once in the total.
Conversion needs new deals in the period. Days to fund needs at least one of those deals funded, and a deal entered after it funded doesn't count toward it.
Rep Commissions come from splits on funded deals. Check the rep's commission percentage, see [Rep commission percentages](/help/rep-commission-percent), and the deal's splits on the **Rep Commissions** page.
This documentation is built and hosted on [Mintlify](https://mintlify.com), a developer documentation platform.